The following blog post is a shortened and slightly amended version of a chapter which I wrote for my PhD thesis. To read the original text in situ, you can access my thesis using this link:
Kit Carruthers PhD thesis (2016) (PDF 28.3 MB) “Metal mobility in sandstones and the potential environmental impacts of offshore geological CO2 storage”
This post (~2,000 words) explores publicly available data from the Department of Energy and Climate Change (DECC) for offshore produced water emissions. The relationship between these data and my experimental work (described here) will be presented in a follow-up blog post. Please click the figures to see the full-size versions.
Overview
The Environmental and Emissions Monitoring System (EEMS) is a database of UK North Sea produced water constituents, with data submitted bi-annually to the system by oil and gas operators as required by their operating permits issued under The Offshore Petroleum Activities (Oil Pollution Prevention and Control) Regulations 2005[1] and The Offshore Petroleum Activities (Oil Pollution Prevention and Control) (Amendment) Regulations 2011[1].
Data includes measured and calculated emissions from 2006 onward, and although primarily a joint industry and government resource, the data is publicly available via the Department of Energy and Climate Change (DECC), for the moment at any rate, since DECC will soon cease to exist. Contact details are provided on the DECC EEMS portal. The EEMS data that I had access to in writing my thesis at the time were up to date in January 2015, and reports data for offshore operating facilities, for the following grouped emissions of:
- Polyaromatic hydrocarbons (PAH)
- Benzene, toluene, ethylbenzene and xylenes (BTEX)
- Heavy metals (As, Cd, Cr, Cu, Hg, Ni, Pb, Zn)
- Alkylphenols
- Organic acids
- Oil-in-water (OIW)
- Naphthalene, phenanthrene and dibenzothiophene (NPD)
From 2010:
- Inorganics (total phosphorous, chlorides, fluorides, total nitrogen, cyanides)
- Total Organic Carbon (TOC)
Unsurprisingly, the majority of the data collected relates to hydrocarbon (oil and gas) compounds, since these are regulated to a maximum of 30 mg/L of OIW in produced water emissions, as per the 1992 Oslo-Paris (OSPAR) Convention and the subsequent follow up recommendations, specifically the Overview assessment of the implementation of OSPAR Recommendation 2001/1 for the management of produced water from offshore installations[2]. So-called ‘heavy metals’ (hereafter, ‘trace metals’) are not currently regulated, however DECC collects data on trace metals in emissions through EEMS.
Of interest to this blog post, and my research as a whole, are the concentrations of trace metals in produced water emissions. The suite of trace metals reported to EEMS was used as the basis for the selection of the 8 trace metals focused on for my thesis (and this post), and are: arsenic (As), cadmium (Cd), chromium (Cr), copper (Cu), mercury (Hg), nickel (Ni), lead (Pb) and zinc (Zn).
Reporting Periods & Locations
Data reporting to EEMS is carried out bi-annually, with reports submitted during 6 month periods. Reporting period H1 is January-June, submitted by 1st September, and period H2 is July to December, submitted 1st March. Data are usually from a single sampling of produced water i.e. not averaged data from several samples in a 6 month period.
On the scheme’s introduction in 2006, only 1 facility reported to EEMS (Fife FPSO – Uisge Gorm). From 2007-H1 to 2013-H2 the mean number of reporting facilities has been 99, although the total number of reporting facilities since 2006 is 116, indicating that facilities have begun reporting during the 2006-2014 period while some facilities have stopped, either temporarily or permanently.
A single facility may also report from more than one sampling point in the facility for each reporting period, for example the Fife FPSO – Uisge Gorm facility reported from three different sampling points for each period from 2006-H1 to when it stopped reporting to EEMS in 2008-H2. Examples of sampling points listed in the dataset include, but are not limited to, “sump tank”, “slops tank discharge”, “degasser outlet” and “overboard”. These are pre-agreed sampling points as part of the permitting conditions and are located after produced water volumes have been calculated and any or all remedial treatment carried out.
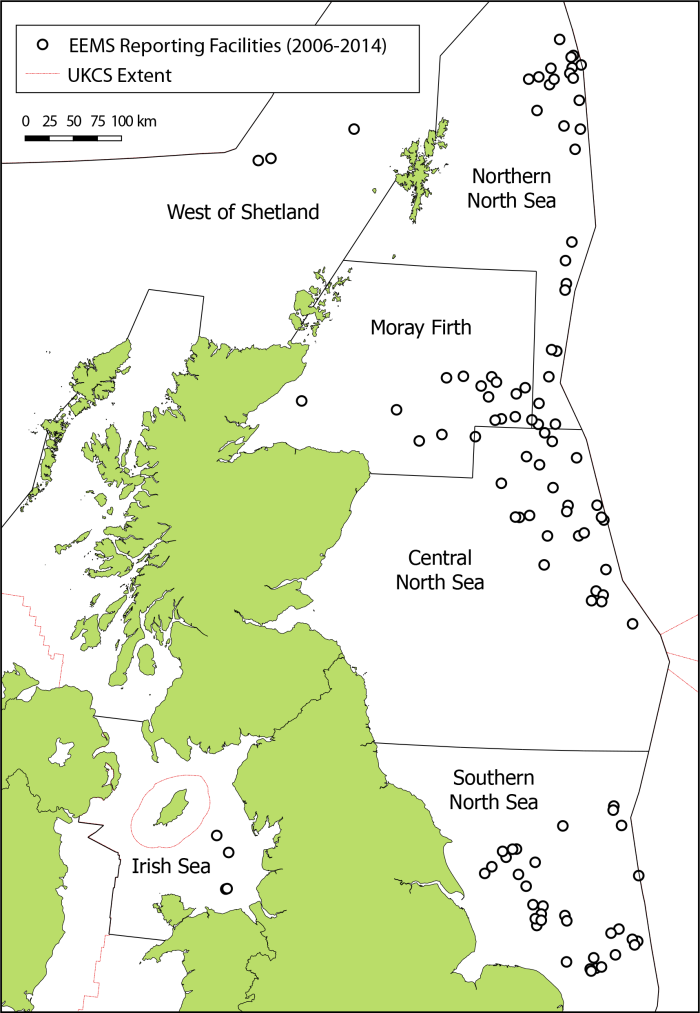
The locations of the facilities reporting to EEMS are given in Figure 1. Exact location data (X-Y coordinates) are not provided in EEMS, however facility names largely correspond to hydrocarbon fields since they are usually the producing facilities for that particular field. Therefore facilities have been plotted in the field locations, and all data associated with the facility is simply assumed to be relevant to that field.
One problem with this approach is that some facilities deal with production fluids from several fields e.g. the Amerada Hess AH-001 facility processes oil from the Renee and Rubie fields, produced from Northern North Sea (NNS) Upper Jurassic and Palaeocene reservoirs, respectively. Reported emissions data from AH-001 are therefore an aggregate of mixed fluids and not necessarily representative of emissions which could be produced from the individual fields.
Also, since fields may be produced from a number of different stratigraphic horizons, EEMS data may represent bulk field fluid composition rather than for individual horizons. However, since the large majority of reporting facilities are named by field, the assumption is made that these facilities produce from only a single field, and that even with multiple horizons sampled, this is still indicative of field conditions.
Data appended to EEMS
In order to interrogate the EEMS data more deeply, the data were appended with other information. The details of these data can be found in the thesis chapter (link at top), however the sources are given here for reference:
- Designated North Sea Areas[3,4,5]:
- The Northern North Sea (NNS)
- The Central North Sea (CNS)
- The Southern North Sea (SNS)
- The Moray Firth (MF)
- The Irish Sea (IS)
- West of Shetland (WoS)
- Carbon dioxide concentrations[6,7]
- Salinity & other dissolved constituents[3,4,7]
- Geological age & formation[3,4,7]
EEMS trace metal data
The 8 trace metals of interest (As, Cd, Cr, Cu, Hg, Ni, Pb & Zn) were selected from the EEMS dataset, and their concentrations analysed against a number of factors, to determine whether any trends could be identified in the data.
Firstly, concentration data for all years 2006 – 2014 was summarised using box-and-whisker plots for the 8 trace metals, Figure 2. The data have been subdivided further based UKCS area and plotted on log10 y-axes to better display the large ranges in concentrations. The boxes shows median value, lower and upper quartiles (interquartile range, IQR). Whiskers are 1.5IQR. Open circles are outlier values > 1.5IQR and white diamonds indicate the mean value.
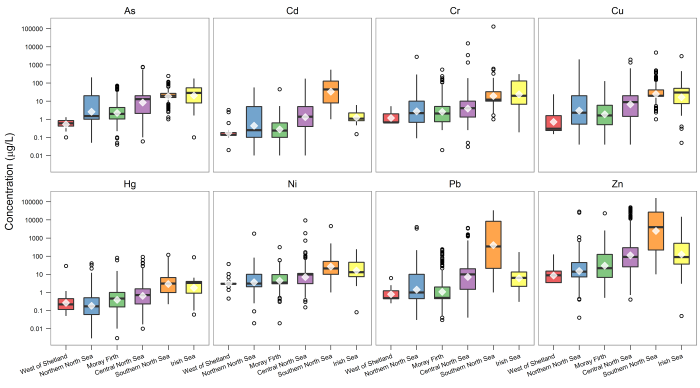
Figure 2. Box-and-whisker plot of trace metal concentrations 2006-2014, grouped by UK Continental Shelf area. Note log10 y-axes.
The UKCS areas are ordered generally north to south as the graphs are read left to right, with the West of Shetland (WOS) considered the most northerly area, with the Southern North Sea (SNS) and Irish Sea (IS) areas given as the most southerly. Given this order, there is an overall increase in median concentrations for each of the elements from north to south, with median concentrations an order of magnitude higher in the SNS and IS than in WOS or Northern North Sea (NNS) for most metals, and up to two orders of magnitude higher for Cd, Pb and Zn. Average concentrations follow the same trend, and on a log10 scale are overall very similar to the median values in most cases.
While median and average values are different for each UKCS area and show a north to south increase, the range of data for each area – as defined by the whiskers and outliers – are effectively the same. The concentration data for Cd, Pb and Zn do, however, show a distribution toward higher concentrations in the SNS than other areas, with maximum concentrations for these elements in the SNS exceeding those in other areas. Broadly, however, taking into account the full range of for all metals then the ranges are very similar across all UKCS areas, Figure 2.
With the data subdivided by the geological age of the reservoir, the same plotting technique can be applied, Figure 3. Concentrations of the 8 trace metals exhibit wide ranges, spanning up to 5 orders of magnitude within a single reservoir age. Carboniferous, Permian and Triassic reservoirs have median concentrations consistently higher than later ages for most of the trace metals, Figure 2. The SNS reservoirs comprise these horizons and so this ties with the elevated concentrations exhibited by these reservoirs.
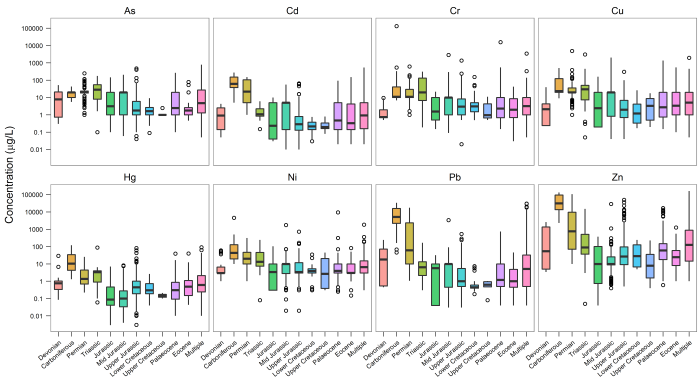
Figure 3. Box-and-whisker plot of trace metal concentrations 2006-2014, grouped by geological age of main reservoir. Note log10 y-axes.
Clearly the reservoirs contributing to production water in each area and by each age are extremely heterogeneous, although some ages appear more homogeneous with regard to particular elements, for example the Cretaceous age reservoirs, Figure 3. Overall, however, produced waters from fields outside of the SNS are likely to produce formation waters which have lower concentrations of these 8 metals than fields within the SNS.
Time-dependent trends
Aggregating the concentration data for all reporting facilities and the entire timespan of the EEMS dataset shows that these trace metals are clearly highly variable within each area, as shown by the spread of data of up to 6 orders of magnitude for individual elements within a geographical area (e.g. Cr, Central North Sea), Figure 2.
Concentration data were then assessed to see whether there are any notable temporal changes in the data. Data were aggregated by area again for all reporting facilities, and the bulk median concentrations calculated for each year. Calculated median concentrtions are plotted in Figure 4.
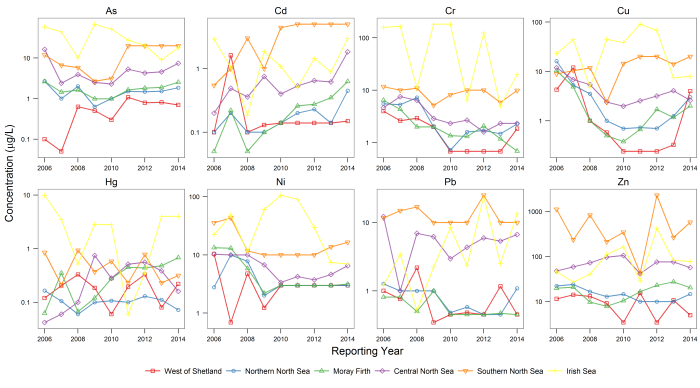
Figure 4. Time series median heavy metal concentrations per UKCS area, aggregating all reporting facilities for the period 2006 – 2014. Note log10 y-axes.
For the majority of the metals and UKCS areas, bulk median concentrations do not appear to change systematically with time. Median values are highest for the Irish Sea and Southern North Sea areas, being up to 10 times higher in most cases than the other areas. The West of Shetland generally has the lowest calculated median concentrations. These are the same conclusions drawn from the box-and-whisker plot, Figure 2.
Median Cd concentrations appear to be increasing between 2006 and 2014 for the Northern North Sea, Moray Firth, Central North Sea and Southern North Sea by up to 1 order of magnitude, whereas Cr concentrations are declining for West of Shetland, Northern North Sea, Moray Firth and Central North Sea, Figure 4.
With the exceptions of Cd and Cr, aggregated trace metal concentrations from all reporting facilities appear to have remained relatively stable over the 8 years of data used in this assessment from DECC, although individual facilities may exhibit their own trends which do not follow those of the wider geographical areas.
Correlating trace metals with supplementary data
The 8 trace metals in the EEMS dataset were tested against total hydrocarbons (H/C), reservoir temperature (T), initial reservoir pressure, total dissolved solids (TDS), pH, metals (calcium, iron, potassium, magnesium, sodium), and chlorides to determine if any correlations existed. Pearson correlation coefficients were generated for calculated linear regressions on cross-plotted pairs of data. The EEMS data was aggregated into a mean for each reporting facility, spanning the period of 2006 – 2014. Calculating the mean EEMS data was required in order that facility data could be compared with data obtained from the literature for other variables such as pH, TDS, Na, etc., of which there is usually only a single value published per field. Field data was matched with facility data based on similarity of names, however it is acknowledged firstly that an EEMS facility may be reporting mixed fluids from a number of fields, and secondly that the field data may have changed since measurements were taken during exploration or initial production (appended data from 1994-2000 publiations).
The strongest correlations, with Pearson correlation coefficients ranging between 0.70 and 0.98 were determined to be between TDS and the major elements reported in the literature (Ca, Fe, K, Mg, Na, Cl). This is of no surprise since TDS is the sum of, among others, major elements in solution. Subsequently, there are strong correlations between these elements, with correlation coefficients ranging between 0.63 and 0.81 for iron (Fe), potassium (K), magnesium (Mg) and sodium (Na). Calcium correlates poorly with other major elements. Na and Cl are the most strongly correlated pair of elements (R2 = 0.96), which is to be expected given that formation waters in the North Sea basin are dominated by NaCl brines.
TDS also correlations well with pH, Figure 5, with an R2 of 0.84 and showing a negative trend. There is a north-to-south increase in salinity in UK North Sea fields, with the gas fields of the Southern North Sea having the lowest pH’s and highest salinities. The low pH values may be indicative of CO2 content in gas fields. Using available literature data on % volume CO2 concentrations, a moderate correlation (R2 = 0.60) between decreasing CO2 and increasing pH is apparent. Increased CO2 could lead to increasing TDS, however the high TDS formation waters of the Southern North Sea are most likely the result of dissolution the regional Zechstein evaporites than from large scale dissolution of the reservoirs from CO2 entrainment. Therefore, while pH and TDS correlate well, they are probably coincidentally correlated and not co-dependent.
The trace metal data from EEMS does not correlate strongly with any of the supplemental data used from the literature, however. Lead and Zn appear to correlate well with Cd, Figures 5 and 6, but only for the Southern North Sea facilities. Again, correlation is not causation and with no strongly identifiable relationship to Cd of any other variable considered, it could be simple coincidence that these elements correlate. No Southern North Sea rock samples were used in the batch experiments, which may have established experimentally some relationship between these elements and a process which may mobilise them.
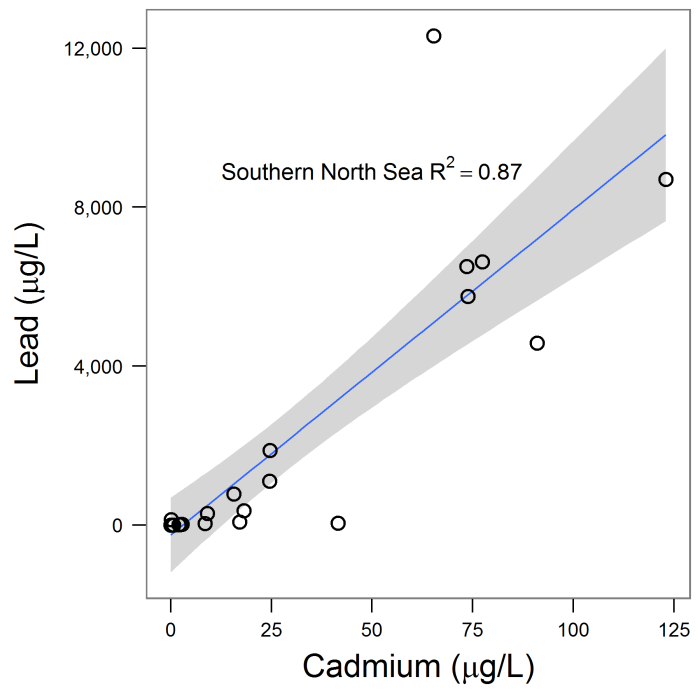
Figure 5. Crossplot of Cd and Pb concentrations UK North Sea EEMS data. Linear regression (line) and standard error (shaded areas) plotted, with associated R2 value.
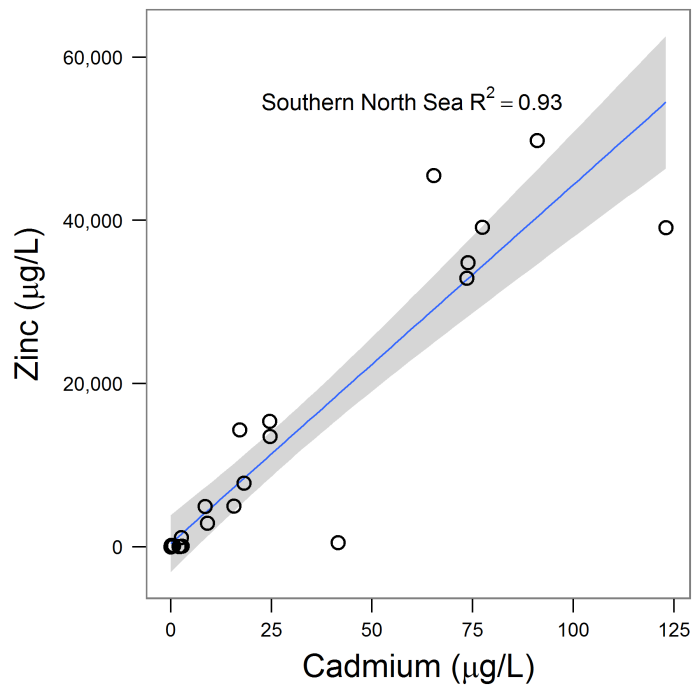
Figure 6. Crossplot of Cd and Zn concentrations UK North Sea EEMS data. Linear regression (line) and standard error (shaded areas) plotted, with associated R2 value.
Summary/conclusions
Data on produced water constituents is reported bi-annually to DECC from permitted offshore UK North Sea facilities to the EEMS dataset. This data is publicly available, and was analysed as part of my PhD thesis.
Data submitted to EEMS from 2006 – 2014 show that concentrations of 8 trace metals (As, Cd, Cr, Cu, Hg, Ni, Pb and Zn) in produced waters are generally highest from reservoirs in the Southern North Sea. Median concentration values show large variations with time across all UKCS areas, but without any apparent trends between 2006 and 2014, with the possible exception of Cd.
Trace metal concentrations do not correlate with any other supplementary data (pH, temperature, pressure, various cations and anions), although there are strong correlations between Cd and Pb, and Cd and Zn for the Southern North Sea.
The relationship between ‘real world’ produced water trace metal concentrations, and the batch experiments carried out for my PhD, will be explored in a follow-up post.
References:
[1] Oil and gas: offshore environmental legislation at http://www.gov.uk
https://www.gov.uk/guidance/oil-and-gas-offshore-environmental-legislation
[3] North Sea Formation Waters Atlas (Geological Society Memoir No. 15, Warren and Smalley, 1994)
[4] United Kingdom Oil and Gas Fields Commemorative Millennium Volume (Memoir of the Geological Society London No. 20, 2003)
[5] The geology of the Moray Firth (British Geological Survey, 1990)
[6] NW European Gas Atlas (PDF 11 MB) (Lokhorst, 1997)
[7] United Kingdom Oil and Gas Fields 25 Years Commemorative Volume (Memoir of the Geological Society London No. 14, 1993)
